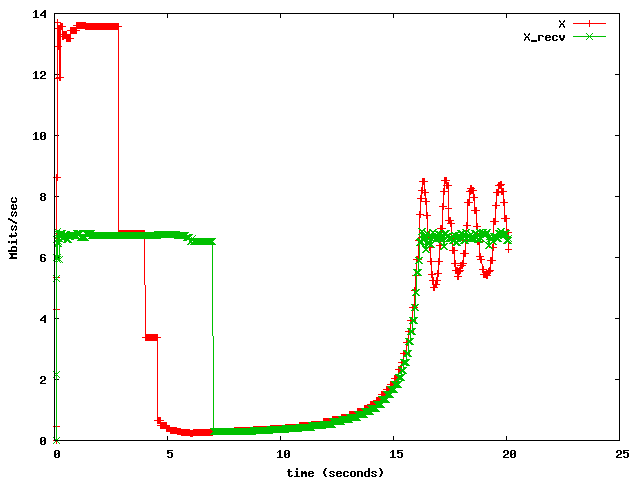
It can be seen that this relationship
only holds in the beginning, at 7 seconds the rate drops to a low
value. The reason is that a loss
occurred; the loss rate p is shown in the next figure.
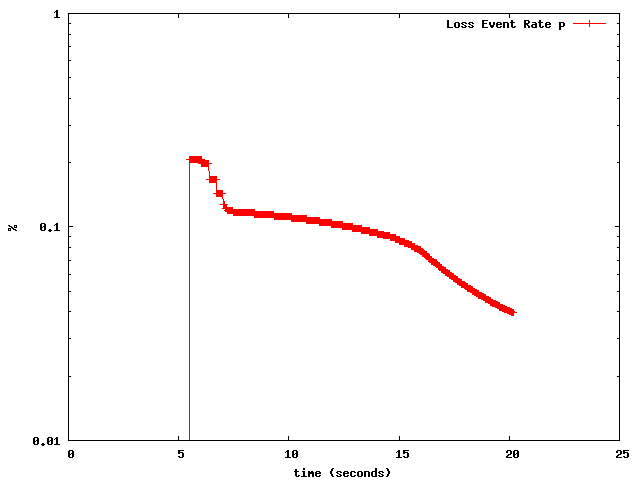

This loss coincides with the drop of
the allowed sending rate X at around 5 seconds, and the reason is that
X now becomes constrained by the
computed sending rate X_calc (RFC 3448, 4.3): this is
plotted next:
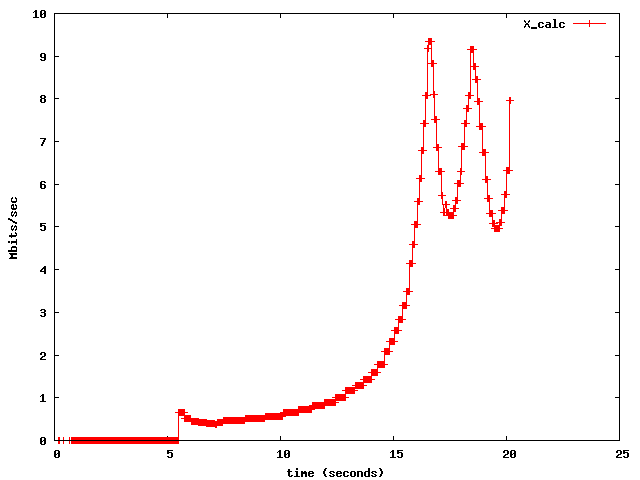

It can be seen that the low value to
which X (and eventually
X_recv) reduces is due to the approximately 800Kbps computed at
around 5 seconds. This value will be verified below.
Still, it is not clear why this loss occurred. The RTT plot reveals more.
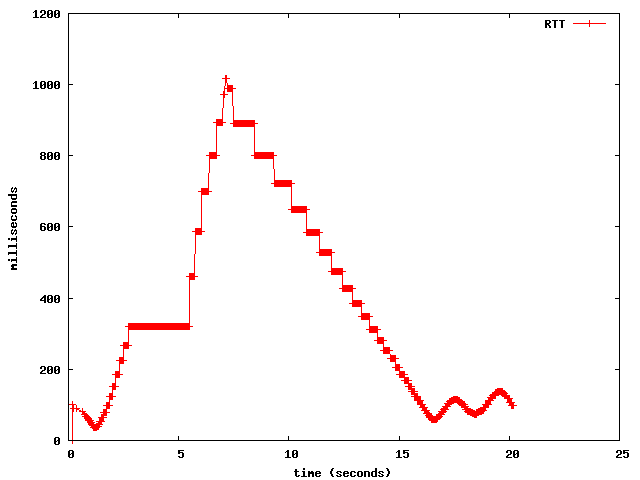
Still, it is not clear why this loss occurred. The RTT plot reveals more.
3.2 Queueing delay and congestion notification
The RTT during slow-start and after, until the loss occurs. This then leads to a decrease in the sending rate and eventually, in turn, the RTT.
The
increase in the RTT here is enormous: from the average link RTT
of 2
milliseconds up to one second.
The reason is that the wireless link acts as a bottleneck: the internal FIFOs of the WRT54G fill up, servicing queued packets increases the overall service time. The queueing delay becomes the dominant factor in the RTT: when a packet arrives at the wireless router, it can only be delivered when all other packets preceding it in the queue have left.
In the extreme case, just before the loss occurs, the packet will have a time approximating the FIFO length multiplied by the time to put a single packet on the link. Using RTT/2 = 1millisecond as service time, the queue length is an estimated 1000 packets.
The loss is detected late. DCCP does not currently support Early Congestion Notification (with ECN, one can set a minimum threshold, after which packets get marked, so that e.g. a congestion notification can be delivered at a queue lengh of, say, 200 packets instead of the estimated 1000 packets above).
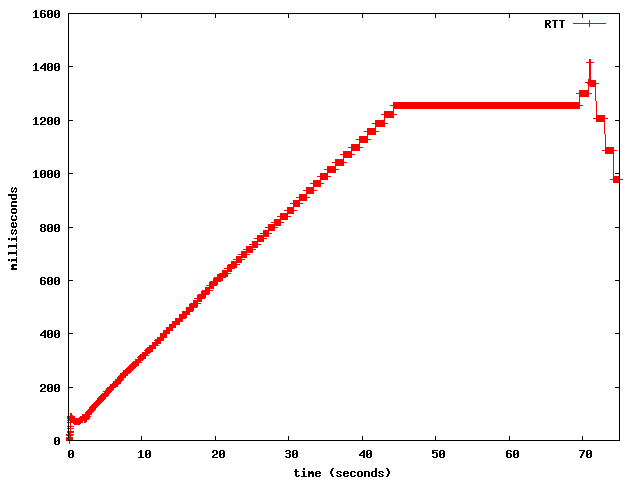
Such a notification is highly desirable, since the build-up of the queueing delay can take much longer than in the above case (10 seconds): for example, when using a CBR source slightly above link bandwidth. This is shown in the graph below, where a 7Mbps constant bitrate source was used (iperf -d -b7m):
The payload size was s = 1400 bytes, the loss rate p was approximately 0.2 % (taken from graphs above). When the loss occurred, shortly after the 5-second mark, the RTT computed at the sender was circa 400 milliseconds. Plugging these values into the TCP throughput equation in section 3.1 of RFC 3448 results in an X_calc of 753 Kbps. With the given estimation errors, this value agrees well with the plotted value of X_calc.
Thus there is double punishment: (i) the large queues cause Late Congestion Notification, (ii) the RTT increase further decreases X_calc.
When p and RTT decay towards more realistic values, X_calc more closely resembles the available bandwidth. This occurs in the above X_calc plot after circa 15 seconds. The figure below confirms this trend, it was taken from an even longer trace (3 minutes):

The reason is that the wireless link acts as a bottleneck: the internal FIFOs of the WRT54G fill up, servicing queued packets increases the overall service time. The queueing delay becomes the dominant factor in the RTT: when a packet arrives at the wireless router, it can only be delivered when all other packets preceding it in the queue have left.
In the extreme case, just before the loss occurs, the packet will have a time approximating the FIFO length multiplied by the time to put a single packet on the link. Using RTT/2 = 1millisecond as service time, the queue length is an estimated 1000 packets.
The loss is detected late. DCCP does not currently support Early Congestion Notification (with ECN, one can set a minimum threshold, after which packets get marked, so that e.g. a congestion notification can be delivered at a queue lengh of, say, 200 packets instead of the estimated 1000 packets above).
Such a notification is highly desirable, since the build-up of the queueing delay can take much longer than in the above case (10 seconds): for example, when using a CBR source slightly above link bandwidth. This is shown in the graph below, where a 7Mbps constant bitrate source was used (iperf -d -b7m):

This time it took over one minute until finally the
loss occurred at 70 seconds. At this time the RTT was 1.2 seconds,
which is frustrating/unusable for interactive applications.
3.3 Verifying the throughput reported in the graphs
To summarise the preceding section, we can verify the computed value of X_calc. At the time the loss occurred (around 5 seconds), the graph for X_calc showed a value of approximately 800 Kbps.The payload size was s = 1400 bytes, the loss rate p was approximately 0.2 % (taken from graphs above). When the loss occurred, shortly after the 5-second mark, the RTT computed at the sender was circa 400 milliseconds. Plugging these values into the TCP throughput equation in section 3.1 of RFC 3448 results in an X_calc of 753 Kbps. With the given estimation errors, this value agrees well with the plotted value of X_calc.
Thus there is double punishment: (i) the large queues cause Late Congestion Notification, (ii) the RTT increase further decreases X_calc.
When p and RTT decay towards more realistic values, X_calc more closely resembles the available bandwidth. This occurs in the above X_calc plot after circa 15 seconds. The figure below confirms this trend, it was taken from an even longer trace (3 minutes):

X_calc now oscillates around 7 Mbps,
which is a more realistic estimate of the available bandwidth.
3.4 Evolution of the RTT over a longer period
One would expect that CCID3's RTT
measurement finally approaches the link RTT of 2 milliseconds,
but such is not the case, as the following long-term plot shows. Again iperf
was used in
bytestream-mode (maximum
speed).

3.4 Evolution of the RTT over a longer period
One would expect that CCID3's RTT
measurement finally approaches the link RTT of 2 milliseconds,
but such is not the case, as the following long-term plot shows. Again iperf
was used in
bytestream-mode (maximum
speed).
The effective RTT reaches an average of
200 milliseconds. This is because the system is under load. If we
deliberately choose a very low load,
such as 2 Mbps CBR traffic, a plot like the one below results.


If we increase
from 2 Mbps to 5 Mbps, more spikes in the RTT result, as shown
in the plot below.


Finally, if we choose 6 Mbps (close to the available maximum),
a build-up of queueing delay can be seen:


In this test run (with 6 Mbps constant bitrate
input), there was no loss. Increasing the input rate further
leads to the graphs shown at the begin of this section.
3.5 Evolution of X_recv and long-term decay of p
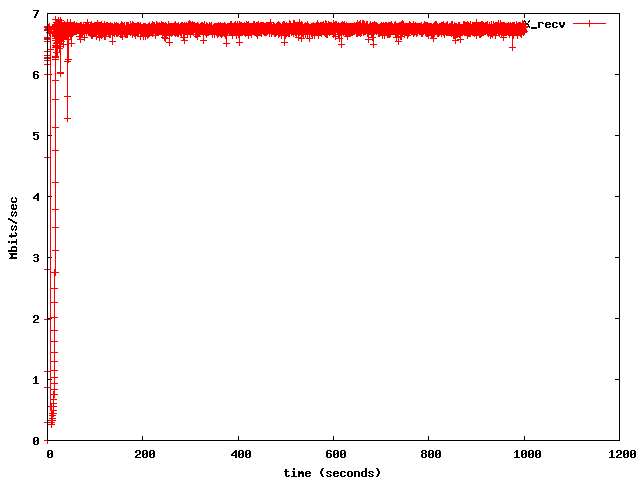
The following diagrams were obtained from a very long run (> 15 minutes). The receiver-estimated bitrate X_recv finally stabilises at around 7 Mbps, which agrees with the average of X_calc shown above.
It takes a long time for the loss to decay, in an
exponentially decreasing fashion:


3.6 Slow-start
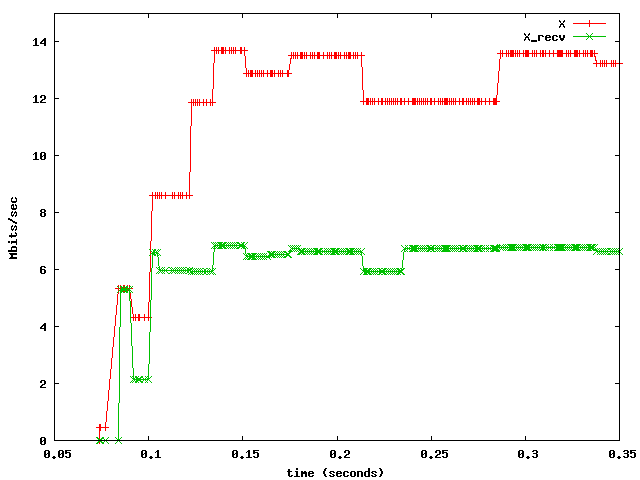
By zooming in on the graphs for the
first second, slow-start can be observed. The following graph shows the
evolution of X_recv, which is the only parameter affecting X during
slow-start:

This can in turn be contrasted with the
growth of the RTT during this period, plotted below.
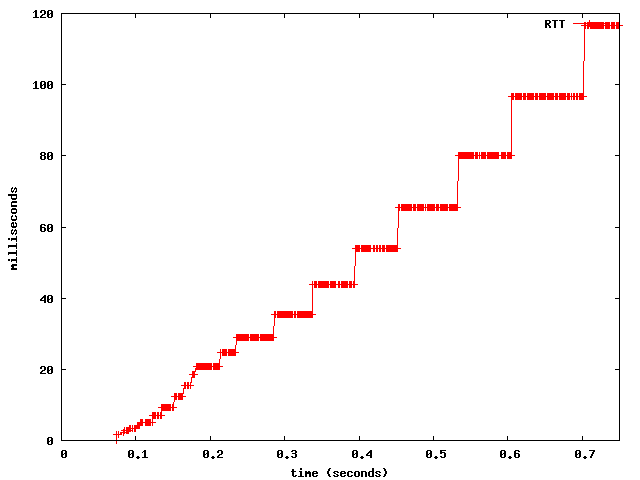

This diagram reiterates the observations
of the earlier RTT diagrams. Here, the staircase-like increase is much
better to see. (The initial
minimum of the RTT at the begin was measured to be 1.67 milliseconds.)